How to Open the Developer Console in Your Browser
by ![]() Lina Thorne • Updated
Lina Thorne • Updated
An array of different things may lead to Watermarkly not working properly, and figuring out which one is the source of the issue in your case can be challenging. The variety of browsers and a ton of available plugins make this task even more difficult. The developer console in your browser can be of great help to us to determine what exactly is causing the problem, so we can then fix it. It logs all the information about the backend operations of our app. This information is a real lifesaver when it comes to troubleshooting.
If you are experiencing a problem with Watermarkly and have already contacted our support, you may be asked to send a screenshot of your Console in the Developer Tools. Here is how you can open it.
Google Chrome
There are three ways to open Developer Tools in Chrome.
Open the Chrome Menu by clicking on the three vertical dots in the upper right corner of the browser window. Select “More Tools”, then click on “Developer Tools”.
Use the keyboard shortcut: Cmd + Option + J (on a Mac) or Ctrl +Shift +J (on Windows/Linux).
Right-click on the webpage and choose “Inspect”. Once the Developer Tools are open, click on the “Console” tab.
Apple Safari
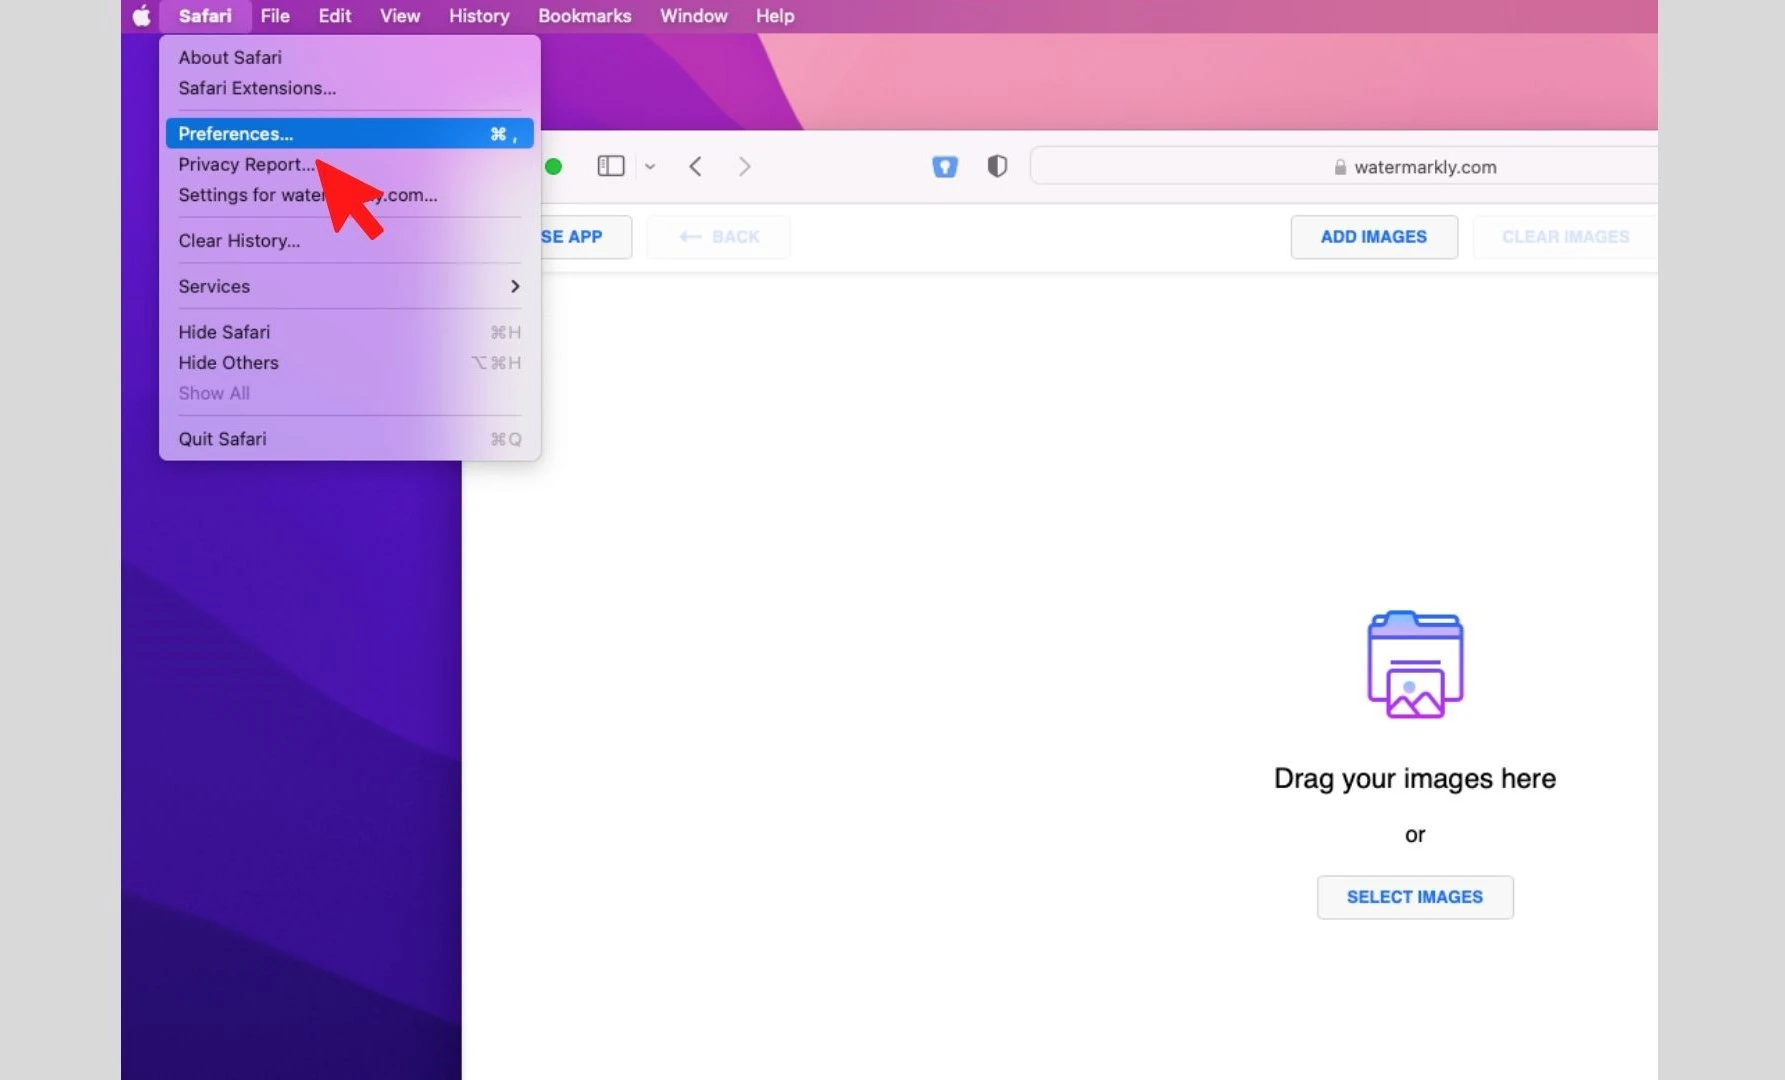
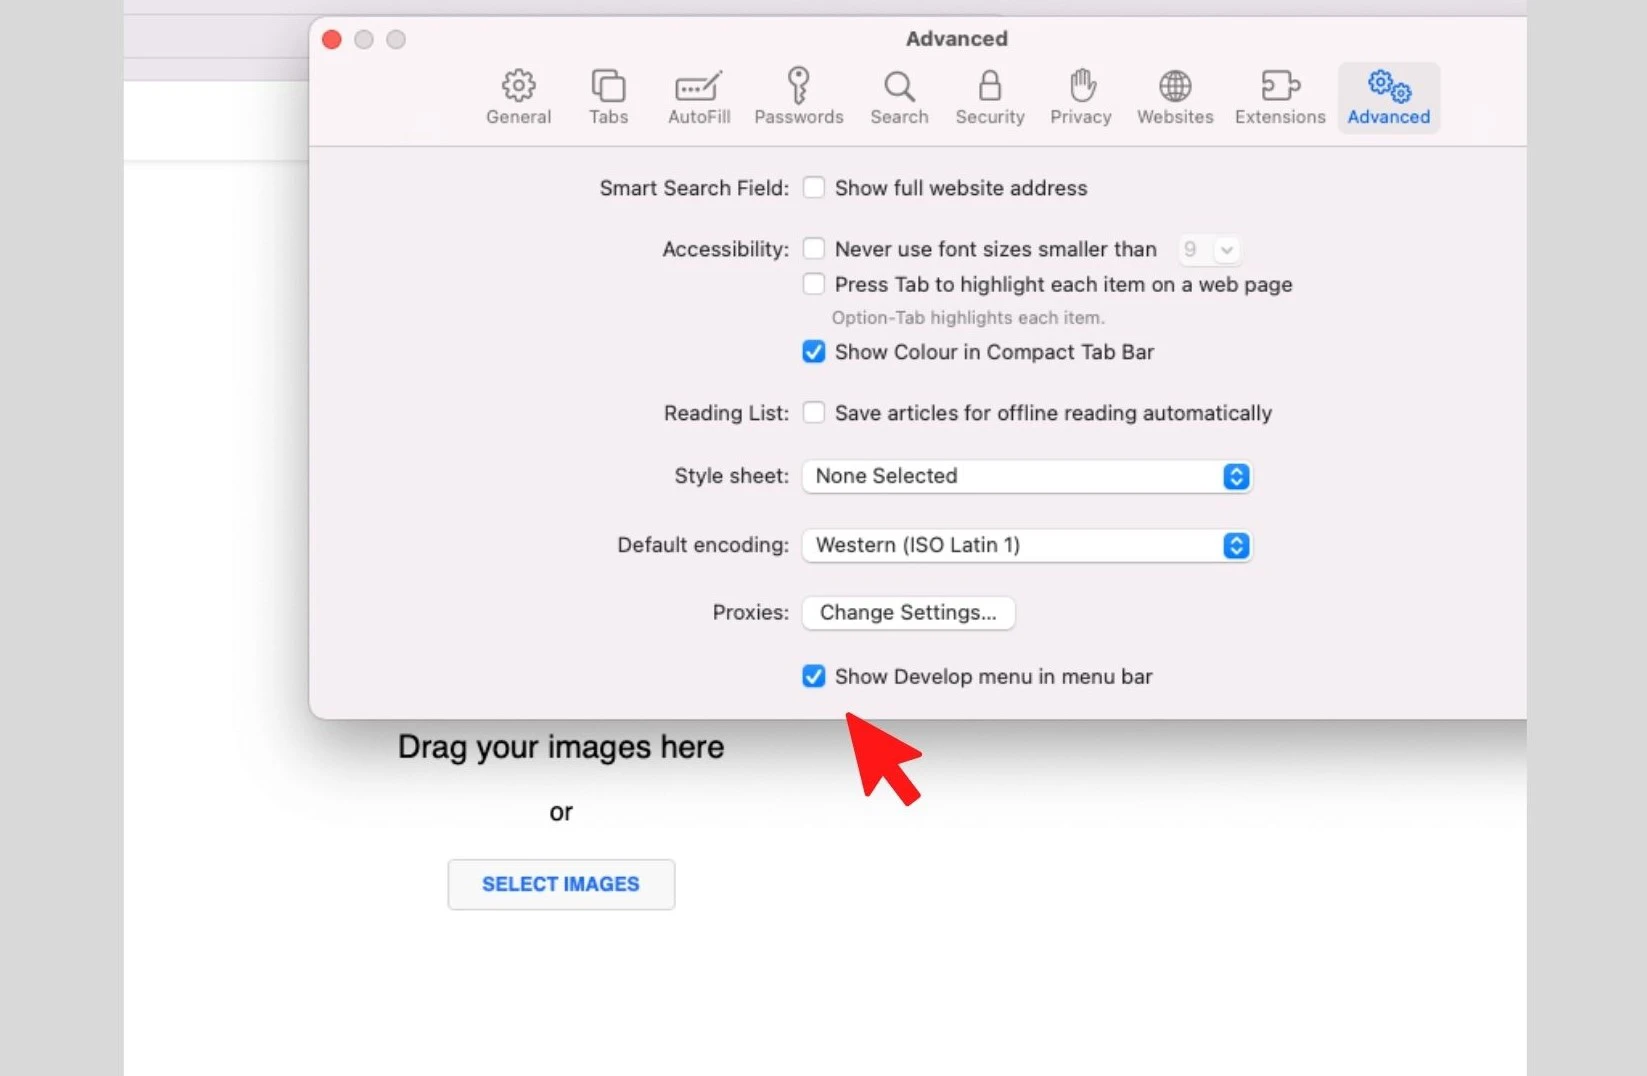
First, you have to enable the Developer Menu. Go to Safari in the Mac menu bar, then select Preferences.
This will open the Preferences dialog box. Click on “Advanced” at the top and set a tick next to “Show Develop menu in the menu bar.” Exit the Preferences window.
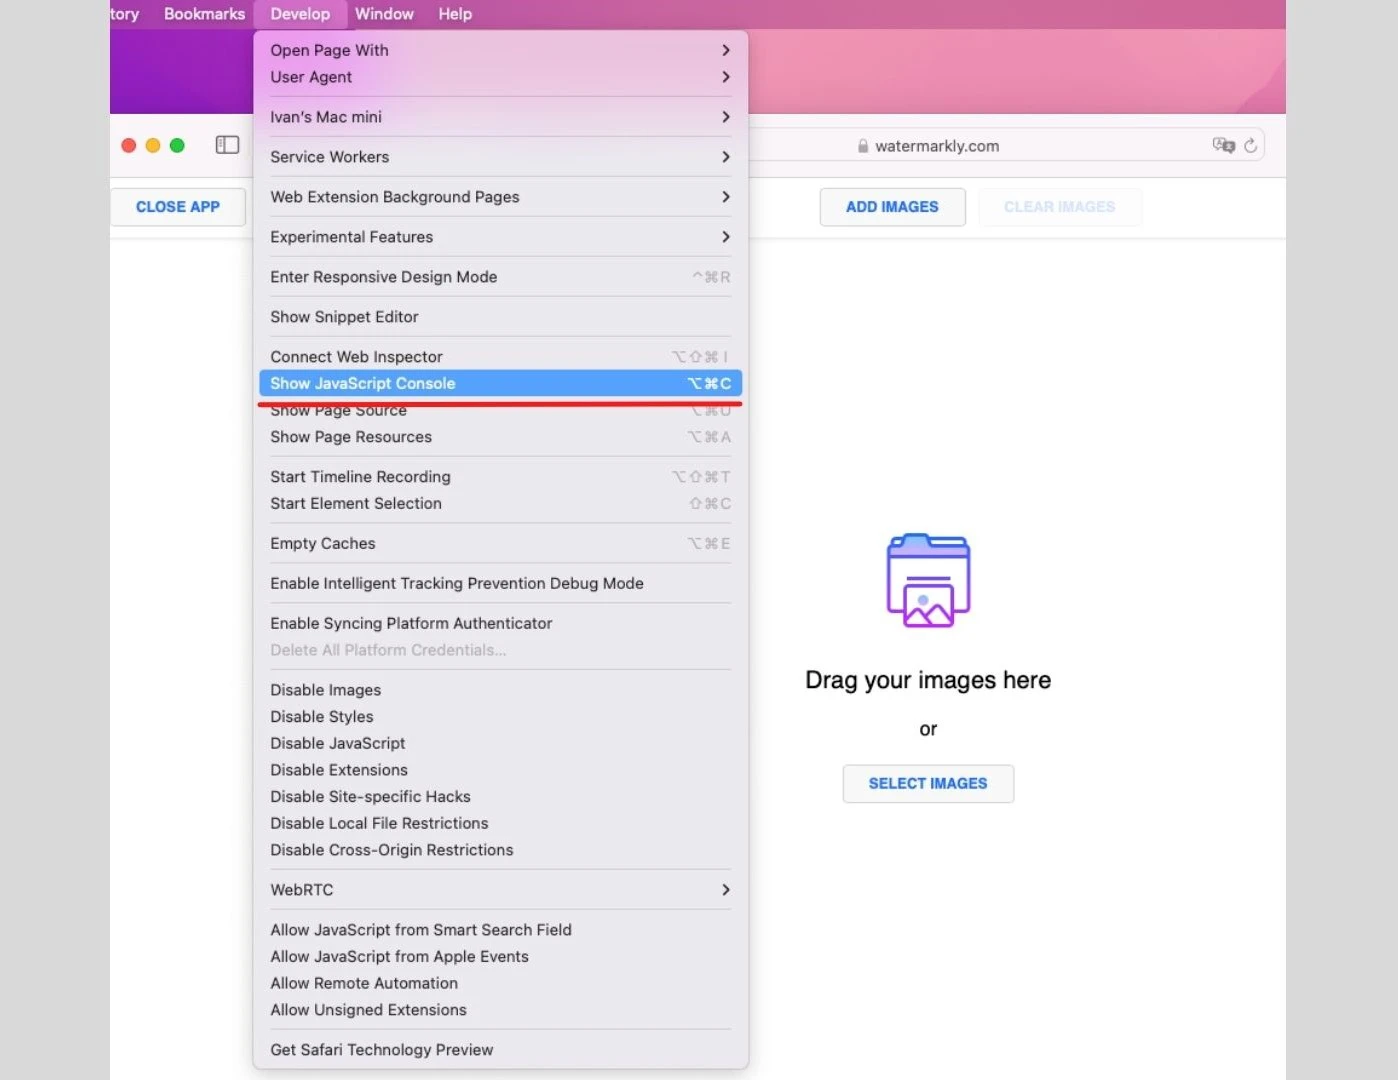
Now, you can access the developer console by:
Going to Develop and choosing “Show Javascript Console”.
Using this keyboard shortcut: Cmd + Option + C.
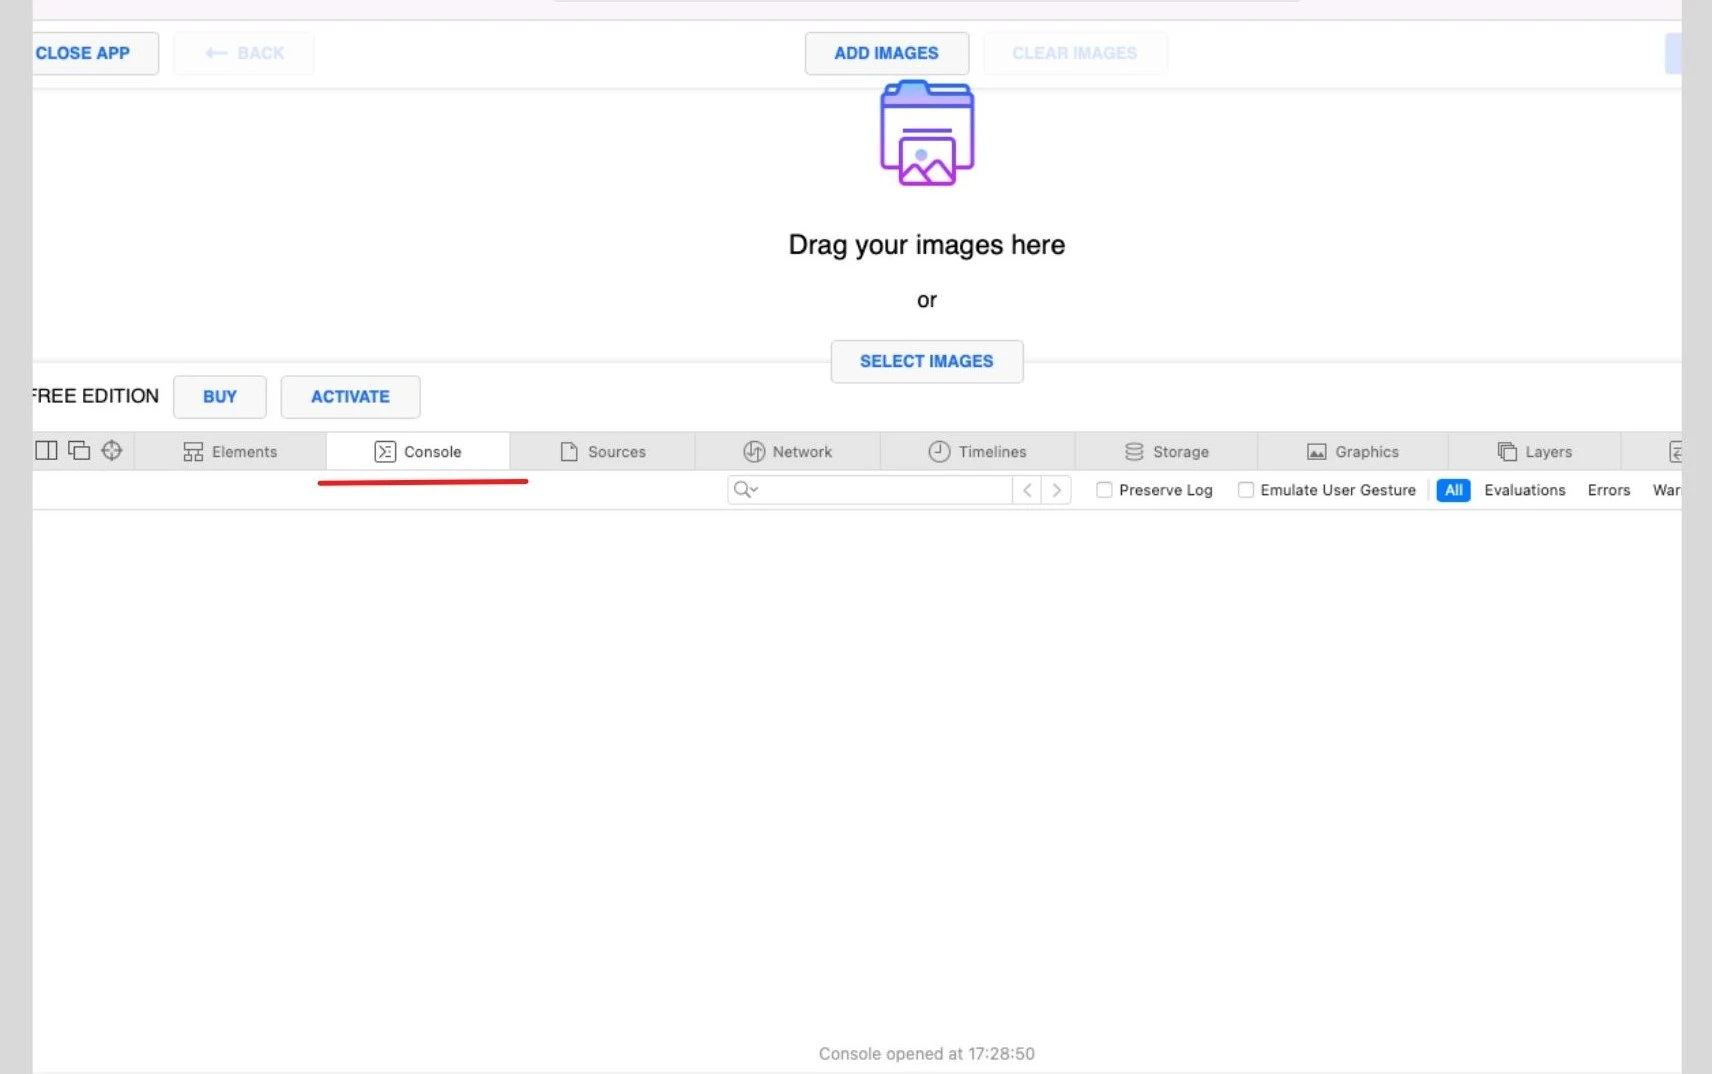
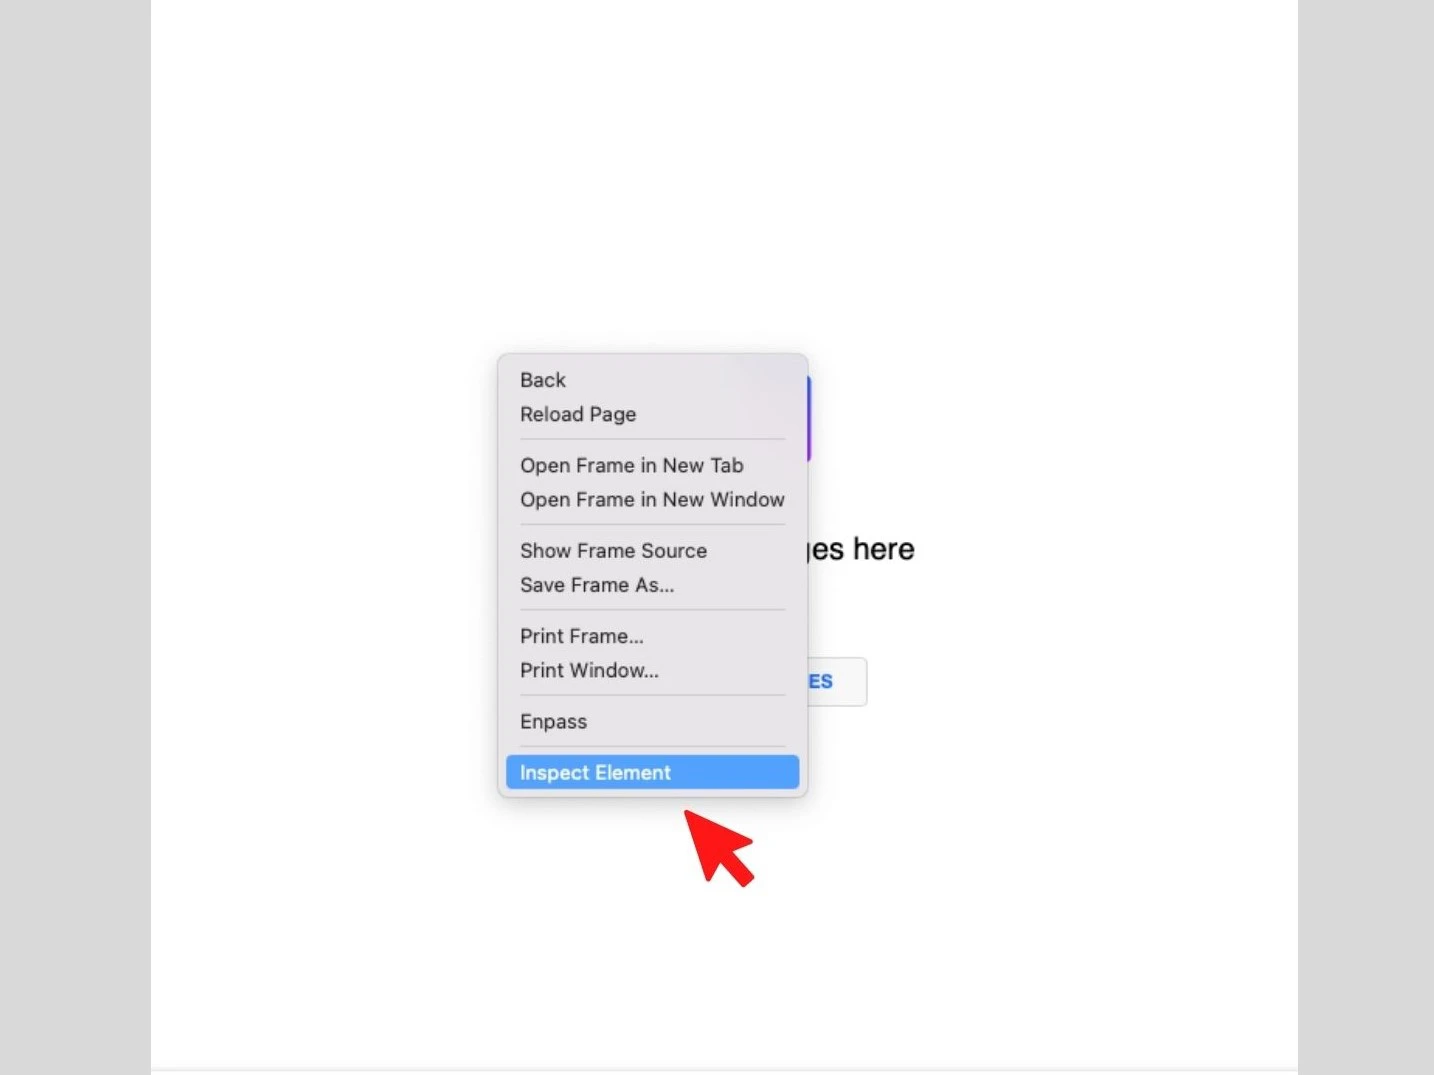
Right-clicking on the webpage and selecting “Inspect Element”. The Developer Tools will appear. In this window, click on the “Console” tab.
Mozilla Firefox
Either of these options will open the Developer Tools in your browser:
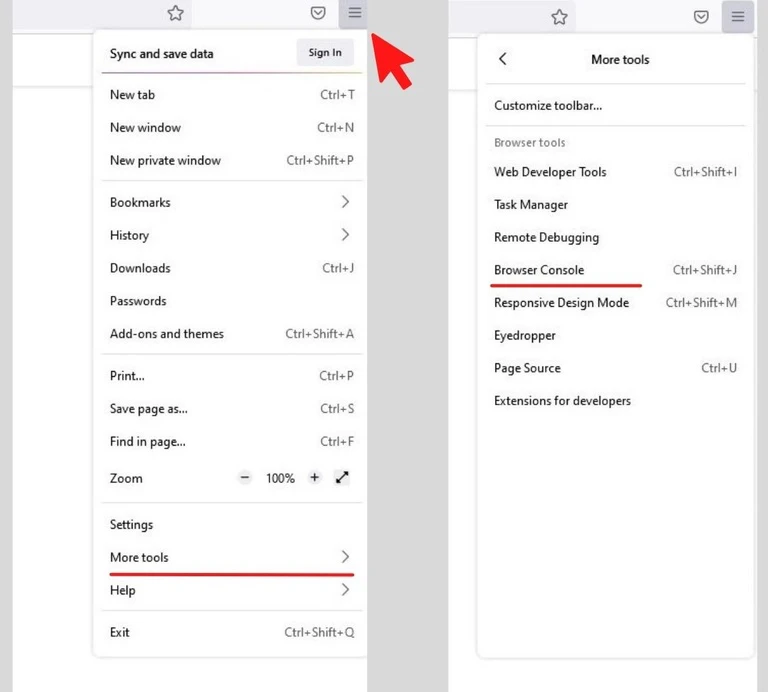
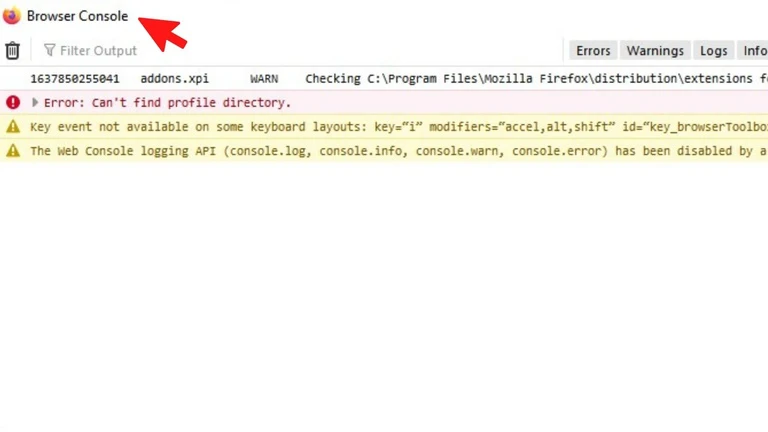
Click on the Firefox Menu in the upper right corner of the browser window. Go to “More Tools”, then select “Browser Console”.
Use this keyboard shortcut: Cmd + Option +K (on a Mac) or Ctrl +Shift +J (on Windows/Linux).
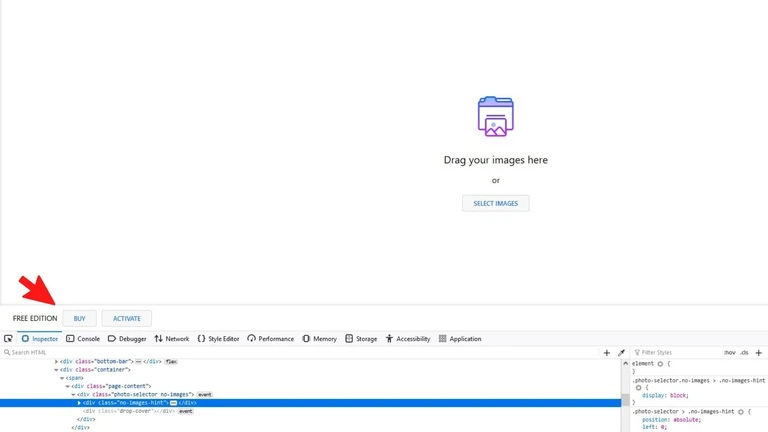
Right-click on the webpage and click on “Inspect Element”. Once you are in the Developer Tools window, select the “Console” tab.
Microsoft Edge
Similarly to the other browsers, you can use one of the following options to access the Developer Tools:
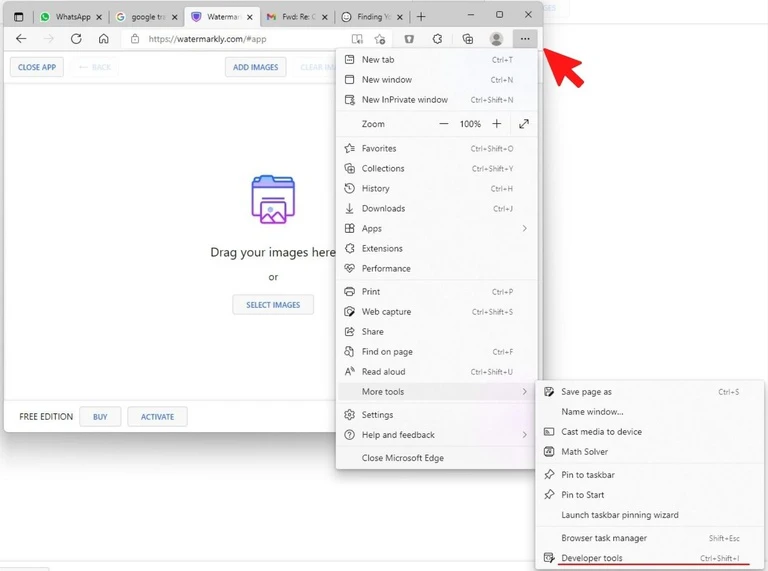
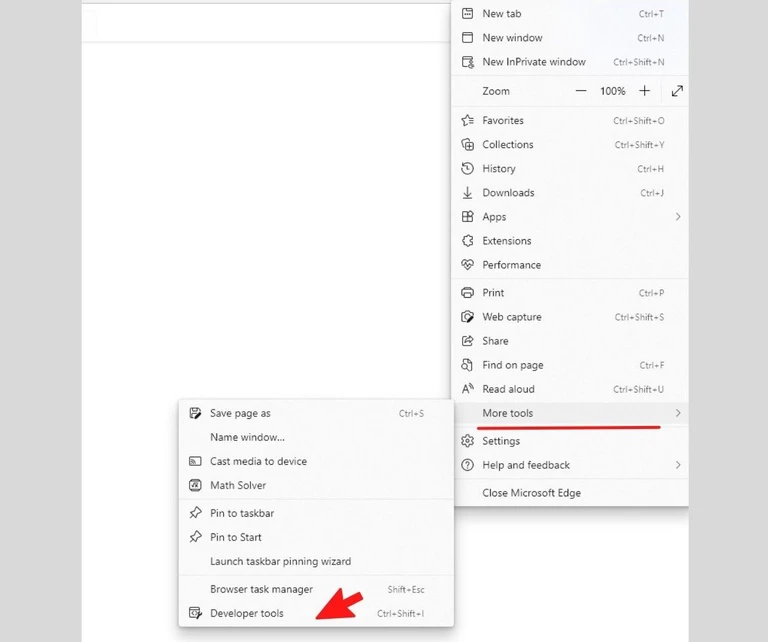
Open the Edge Menu in the upper right corner of the browser, go to “More Tools” and choose “Developer Tools”.
Press “Ctrl+Shift+I” if you are on Windows/Linux or “Command+Option+I” if you are on Mac.
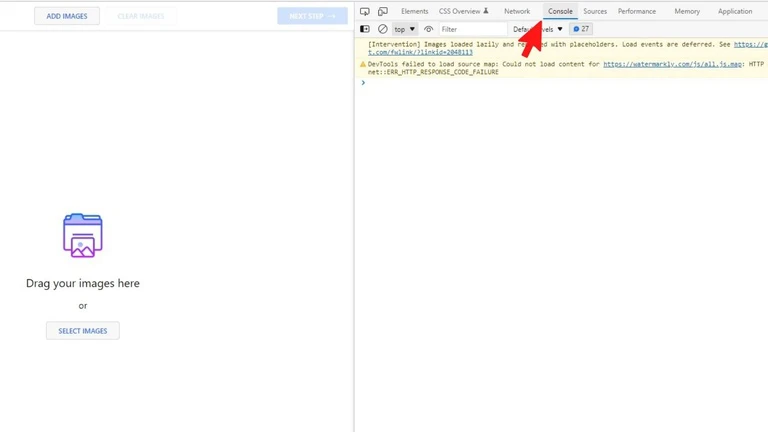
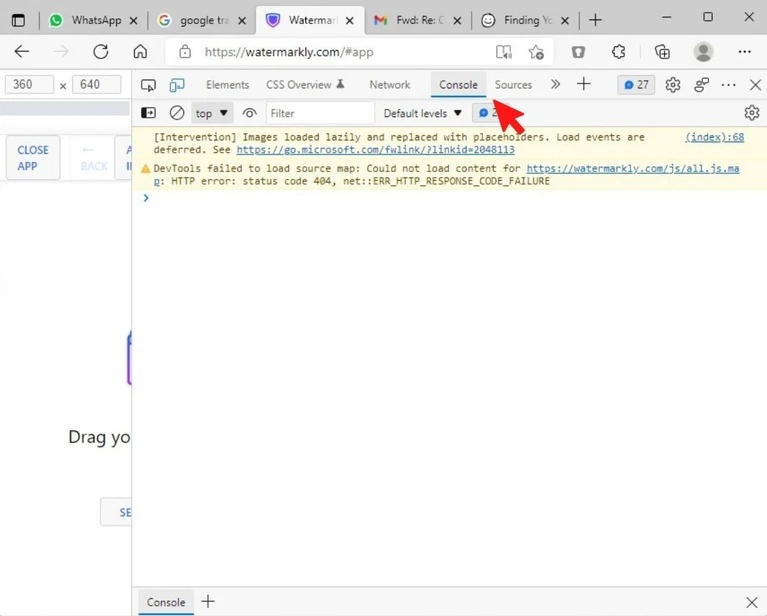
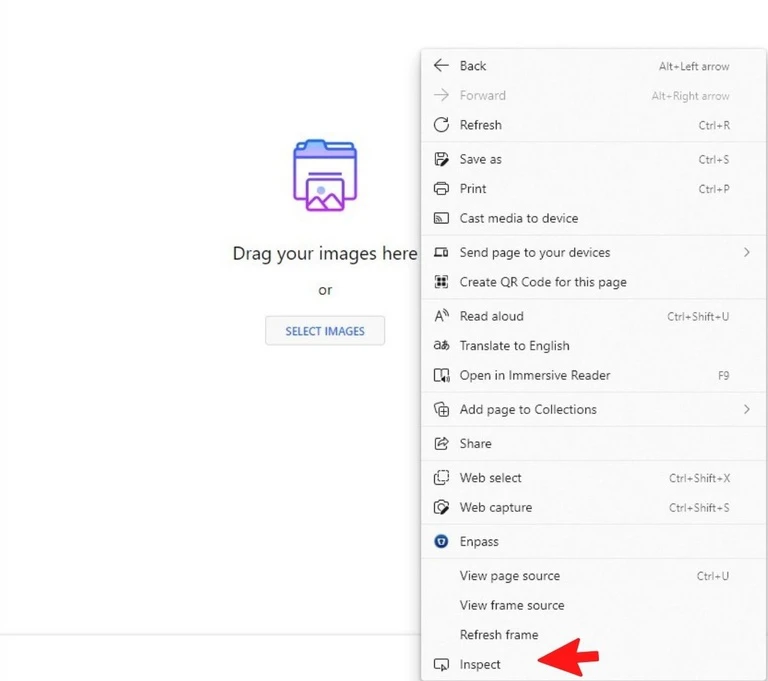
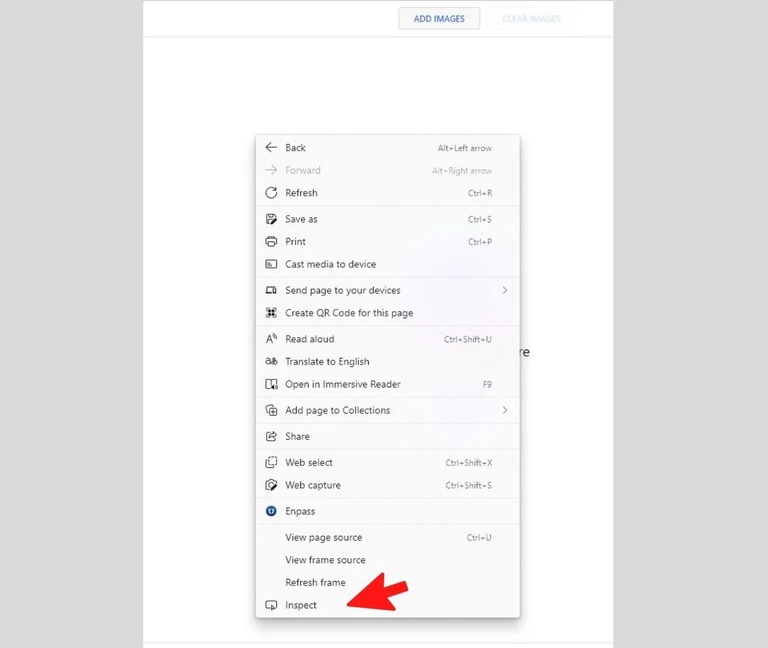
Right-click on the webpage and select “Inspect” in the drop-down menu. After the Developer Tools window opens, select the “Console” tab.
Opera
Use one of these three ways to access the Developer Tools in Opera:
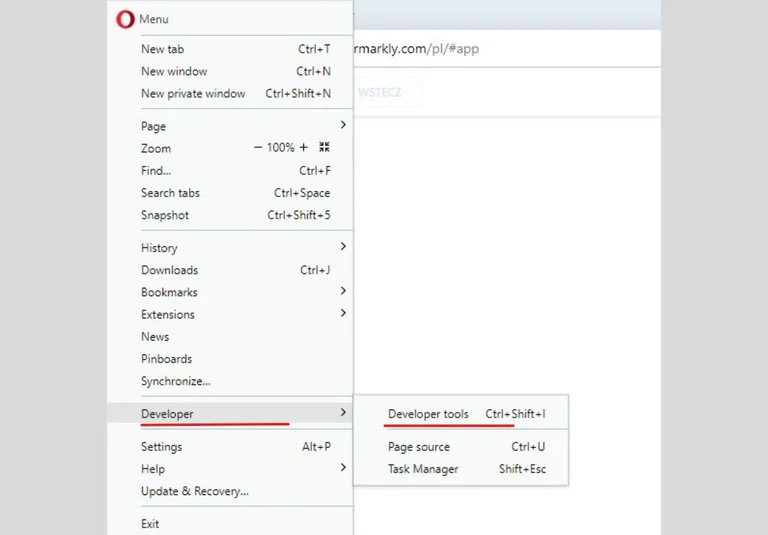
Click on the “O” button in the upper left corner of the browser window, then go to “Developer” in the menu, and select “Developer tools”.
Use the shortcut Ctrl+Shift+I on Windows/Linux or Cmd+Option+I on Mac.
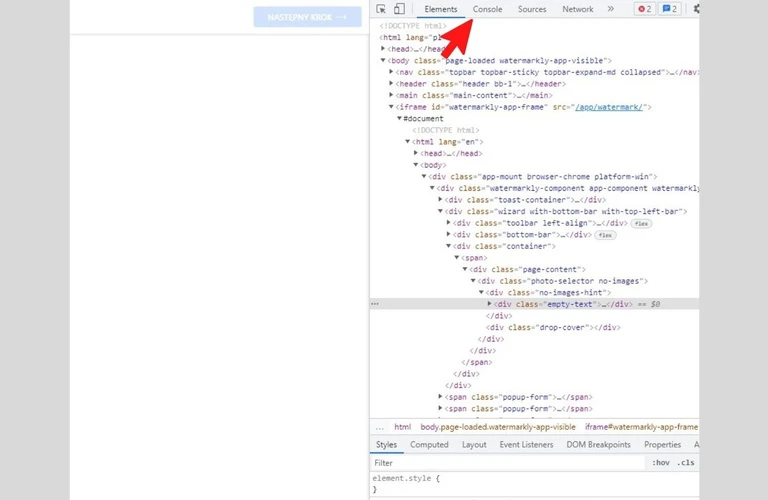
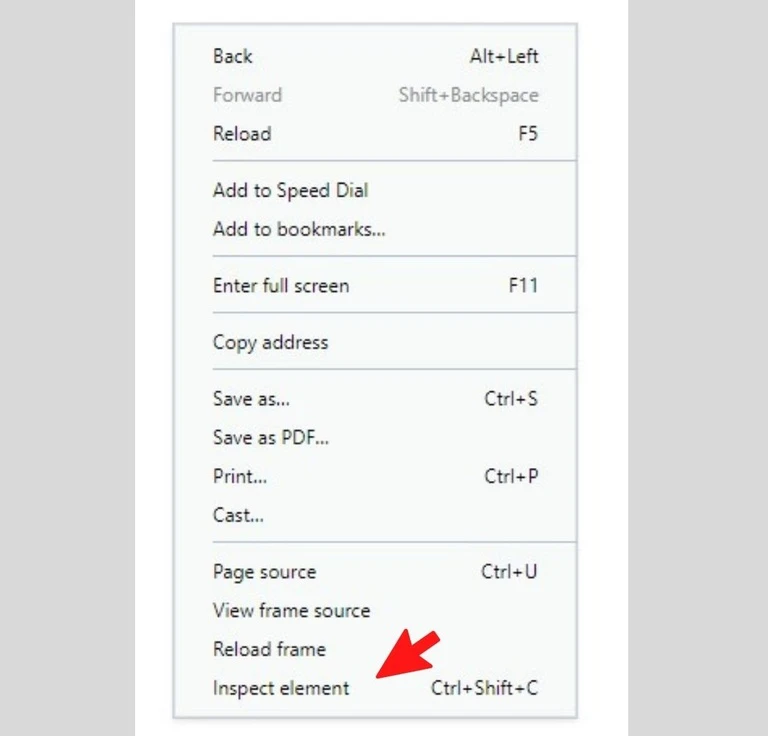
Right-click on the webpage and choose “Inspect element” in the drop-down menu. In the Developer Tools section that will open, click on the “Console” tab.
Accessing your Developer Tools is incredibly easy, and the process is quite similar for all the popular browsers.